Tag Archives: weather

Flying “the long cross county” 1, 2, 3 times…

Only the federal government could come up with a requirement for a 300 nautical mile flight with a landing at least 250 miles from where you started. If you fly out 250 and turn around and fly 50 you’ve flown 300 miles, but are still 200 miles from home. What do you do for the other 200 miles? Hmmm.

I’d like to fly part time as a retirement career. I’m doing the training to prepare for that.

The “long cross country” flight I mentioned above is part of ten hours of required solo aeronautical experience for a multi-engine commercial pilot – which is what I’m trying to become. These ten hours must also include five hours at night and ten night landings at an airport with a control tower.

It’s been a surprisingly convoluted process, but the ten hours are done. I have four of the ten night landings done. Last night, after the third try I finished the long trip.

Flight plan to Apalachicola, FL – where I didn’t make it!

Back in the fall after work one day I launched towards an airport on the Florida gulf coast. Note “after work.” Everything took longer than expected. I would be arriving at my destination after fuel service stopped. Way after. I was getting tired. If I was this tired before finishing the first half of the trip, it was going to be a really bad idea to try to find avgas and turn around and fly back. What to do?

I chose to land at Tallahassee and spend the night. It’s OK to do the trip across a couple days. So, gas in the morning, fly south, land, turn around and fly back. Uh, not so fast. A huge tropical storm was moving in from the Gulf. Not only was I not going to be able to fly south, if I didn’t fly directly home I’d be stuck in the storm for a few days. So, home I went with no credit for the long cross country. It did count for solo flying, night flight, and a night landing, so not a total loss.

I was confident the emergency gear extension would work.

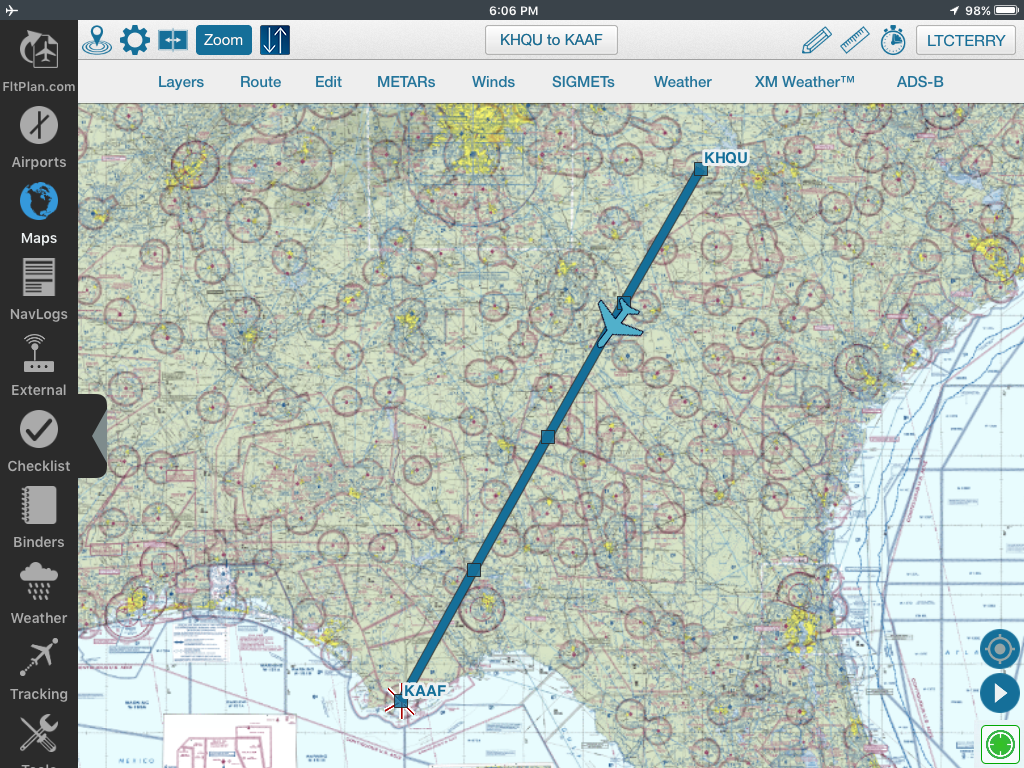
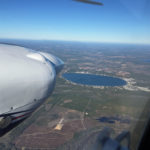
Try number two was two weeks ago. This time I went north. I planned a trip to fly to North Carolina in the afternoon, eat some BBQ, and fly back at night. It was an absolutely gorgeous afternoon. The flight went great. I could see the airport in the distance. I slowed down and began to plan a descent. Lowered the landing gear. Pop! Nothing happened but the circuit breaker popped. After some troubleshooting I chose to fly home – the weather was great and I had plenty of gas. I was confident the emergency gear extension would work.

Manual gear extension eventually worked fine. I was happy to land. It was a night landing, but no control tower, so “no credit” for that. Because I didn’t land elsewhere, despite flying over 500 nautical miles, the flight counts only as “local” and not “cross country.” Not a total loss as at least it counted for total time and night time.

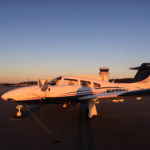
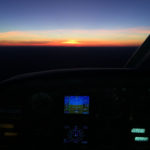
Third time’s the charm, right? I launched for North Carolina right on time, repeating the previous trip. Tail winds were better at 3,000 feet than higher, so I stayed low until I got tired of the bumps. Climbed to 5,500. Beautiful. I had a 27-knot tail wind and once in a while a ground speed hitting 180 knots. (I knew in the back of my mind the trip home would be against a head wind, but the wind dies down after sunset, right?)

Ellis Airport, KOAJ, airport diagram, with my location marked.

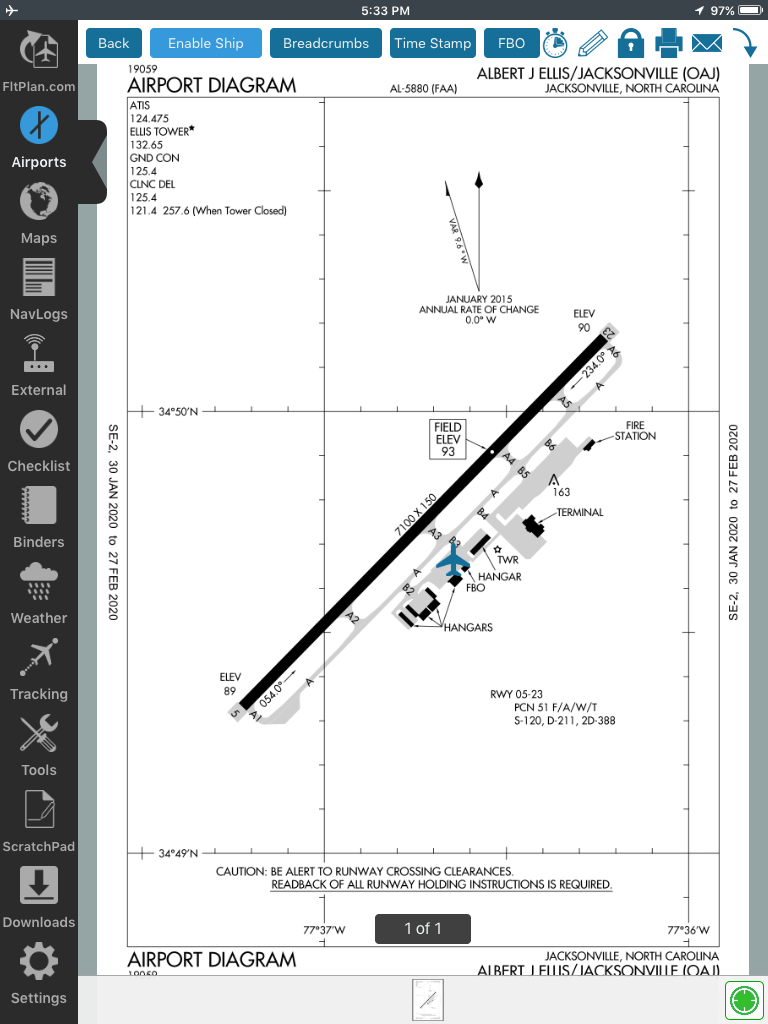
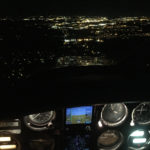
The landing gear came down fine. I landed, borrowed a car, and had a BBQ sandwich. Shortly after sunset I launched for home. Slow. Excruciatingly slow. In an airplane that can cruise at 140 I once had a ground speed of just 99 knots. 99 knots… Ground speed hovered around 100-102 for most of the flight, but slowly increased to 107. I slowed to 100 knots indicated as I hit 10 miles from home base. Ground speed went to 68 knots. Yikes. I’m paying $310/hour to fly an airplane that can do almost three miles a minute but only doing barely a third of that.

I need to go take the knowledge test, fly the last six night landings at a controlled field, and prep for the checkride. It’s slowly coming together. 🙂

10 great online weather tools you may not know about

[This content is courtesy of John Zimmerman at Air Facts Journal.]

All pilots are required to conduct a weather briefing before each flight, whether that means calling Flight Service or looking up the weather online. But for true weather geeks, a pre-flight weather briefing can be a lot of fun, not just a requirement to be completed as quickly as possible. And for pilots looking to go beyond the basics, there is a wealth of information online with details about ceilings, visibility, turbulence, icing and more.

G-AIRMET

Everyone has their list of favorite weather sites. Here is my top 10 list of useful weather websites that aren’t as well known as they should be (and they’re all free):

1. Graphical AIRMET tool
AIRMETs have a well-deserved reputation for being fairly worthless. They are hard to understand unless you can see them on a map, and they often warn of turbulence over half the country. But this new tool rescues the AIRMET from the trash bin, with some nice enhancements to the classic product. For example, you can quickly overlay multiple AIRMETs (low level turbulence, high level turbulence, icing, etc.) on the same chart, and you can view predicted AIRMET coverage areas about 12 hours into the future. It’s a nice way to view the trend, so you can get a feel for whether conditions are improving or deteriorating. It’s also easy to hide AIRMETs that don’t affect your flying (for example, high level turbulence if you fly a Cessna 172).

2. TAF graphics.
The Terminal Aerodrome Forecast (TAF) is a valuable product, and is used by pilots of all levels. While the text has all the important details, sometimes a visual depiction of TAFs can offer clues about how widespread low ceilings are or what the trend is for low level winds. The TAF graphic makes it easy to view this information on a single chart, at three hour intervals in the future. You can also look at a single weather features–clouds, weather conditions, forecast winds and wind gusts–over time. This is an experimental product right now, and you’ll want to read the actual TAF for complete details, but there is a lot of information here at a glance.

3. Medium range forecasts.
Most aviation weather sites show the prognostic charts, with high/low pressure centers and fronts, up to 48 hours out. But sometimes you want to get an idea about the weather further out than just two days. That’s where this site, from the National Weather Service, comes in. It offers 3-7 day forecast graphics on a simple-to-use page, and you can even loop the images. The further out a forecast goes, the less reliable it tends to be, so you’ll want to use these charts as a general guide. But for long trips a few days out, I’ve found this to be a helpful tool.

4. CWSU national map.
This map is my favorite all-in-one tool for looking at surface weather trends. This nationwide map graphically shows all METARs, including ceiling, visbility, cloud cover, wind direction and speed and other data. You can mouse-over a station for current weather conditions and the TAF. Clicking on a station brings up an detailed page with the last 24 hours of weather information, including some graphs. This is an invaluable tool for VFR pilots planning cross-country flights, and even IFR pilots when faced with low visibilities. It’s a great way to find an alternate airport, too.

5. Historical METARs.
Have you ever completed a flight and wondered a few days later what the weather really was? Or maybe canceled a flight and wished you could see how it really turned out? This site, definitely for the real weather geek, has METARs archived all the way back to July 30, 1998. You pick the state, the date and the time and you’ll get a list of the METARs at that time. This isn’t really a pre-flight tool, but it’s an excellent way to learn about weather and improve your own forecasting.

Ceiling and visibility chart

6. C&V chart.
This is a slightly different take on the graphical METAR idea. Here, the chart tries to fill in the blank spots between airports, so instead of station plots you can see wide areas of ceiling and visibility restrictions. This is obviously an educated guess, but it can give the VFR pilot a reality check on low weather days, especially when METARs are widely scattered.

7. Skew-t/log-p charts.
Skew-t plots are where serious weather geeks really get excited. They are certainly not easy to read, and I wouldn’t argue that they be part of every pre-flight briefing. But they are educational and can offer some important clues for pilots, especially if you’re interested in convection or icing threats. The Skew-t chart, among many other things, shows the temperature, dewpoint and wind speed at different altitudes. With some practice, these graphs can reveal how stable the atmosphere is, where wind shear may exist and even how thick a cloud deck might be. There are a number of websites that provides Skew-t plots, but the RUC Soundings site from NOAA is the most powerful. You can view forecast Skew-t/log-p plots, and center it on an airport by entering the identifier. Be sure to click “Java-based plots” for the most full-featured display.

8. Full resolution looping NEXRAD.
Probably every pilot checks the radar before flying, and there are plenty of options for this. But this site is the full resolution image from NOAA, and it shows the entire country (you can even loop the image). It’s a big page, but it’s a fantastic look at the latest picture, and my go-to during thunderstorm season. You can also click a location on this big map for individual NEXRAD site radars, where you can compare base and composite reflectivity. On this map, you can click for the lat/long, which I’ve found to be helpful for flight planning around airspace.

9. Turbulence and icing forecasts.
The threat of turbulence and airframe icing are usually high on the list of concerns for pilots. Up until a few years ago, the only way to plan for these events was to combine PIREPs, area forecasts and a healthy dose of gut feel. But the Aviation Weather Center website has recently added some great new forecast tools. They both operate similarly, allowing you to view the probability of ice or turbulence at different altitudes at different times in the future. These are obviously models, but in my experience they are quite accurate (especially the icing tool). If you canceled every time there was a cloud deck and the temperature was below freezing, you would never fly in some parts of the country. This tool allows you to make a better plan, potentially changing departure time, route or altitude to minimize your exposure. PIREPs are still piece of the puzzle, but these charts can add more detail.

Flight Path Application

10. Flight Path Application.
This is really a downloadable Java application, not a website, so it’s definitely for power users. But for education or serious flight planning, it has some unique features that can’t be done in a web browser. You can enter your route of flight, then view different weather products along your route. You can also see a profile view of your flight, including the graphical icing forecast (above), allowing you to choose the right altitude quickly and easily.

To stay up to date on the latest weather tools from NOAA, check the ADDS website occasionally. This is the place to preview new products that aren’t ready for full deployment yet, some of which can be very handy for flight planning.

On top of these great websites, there are some fantastic iPad apps if you’re a tablet user. I’ll save that list for another article, but I will mention that RadarScope is my favorite app when it comes to serious weather watching.

What’s on your list?